Company
Harvard Business School
Role
Product designer, the only designer
Time frame
2024 · new UI layer 2026
Project
LIFE Matrix
Tools & methods
Prototypes · design principles · weekly working sessions
Outcome
Approved by HBS professors and researchers · no usage data
Context & scope
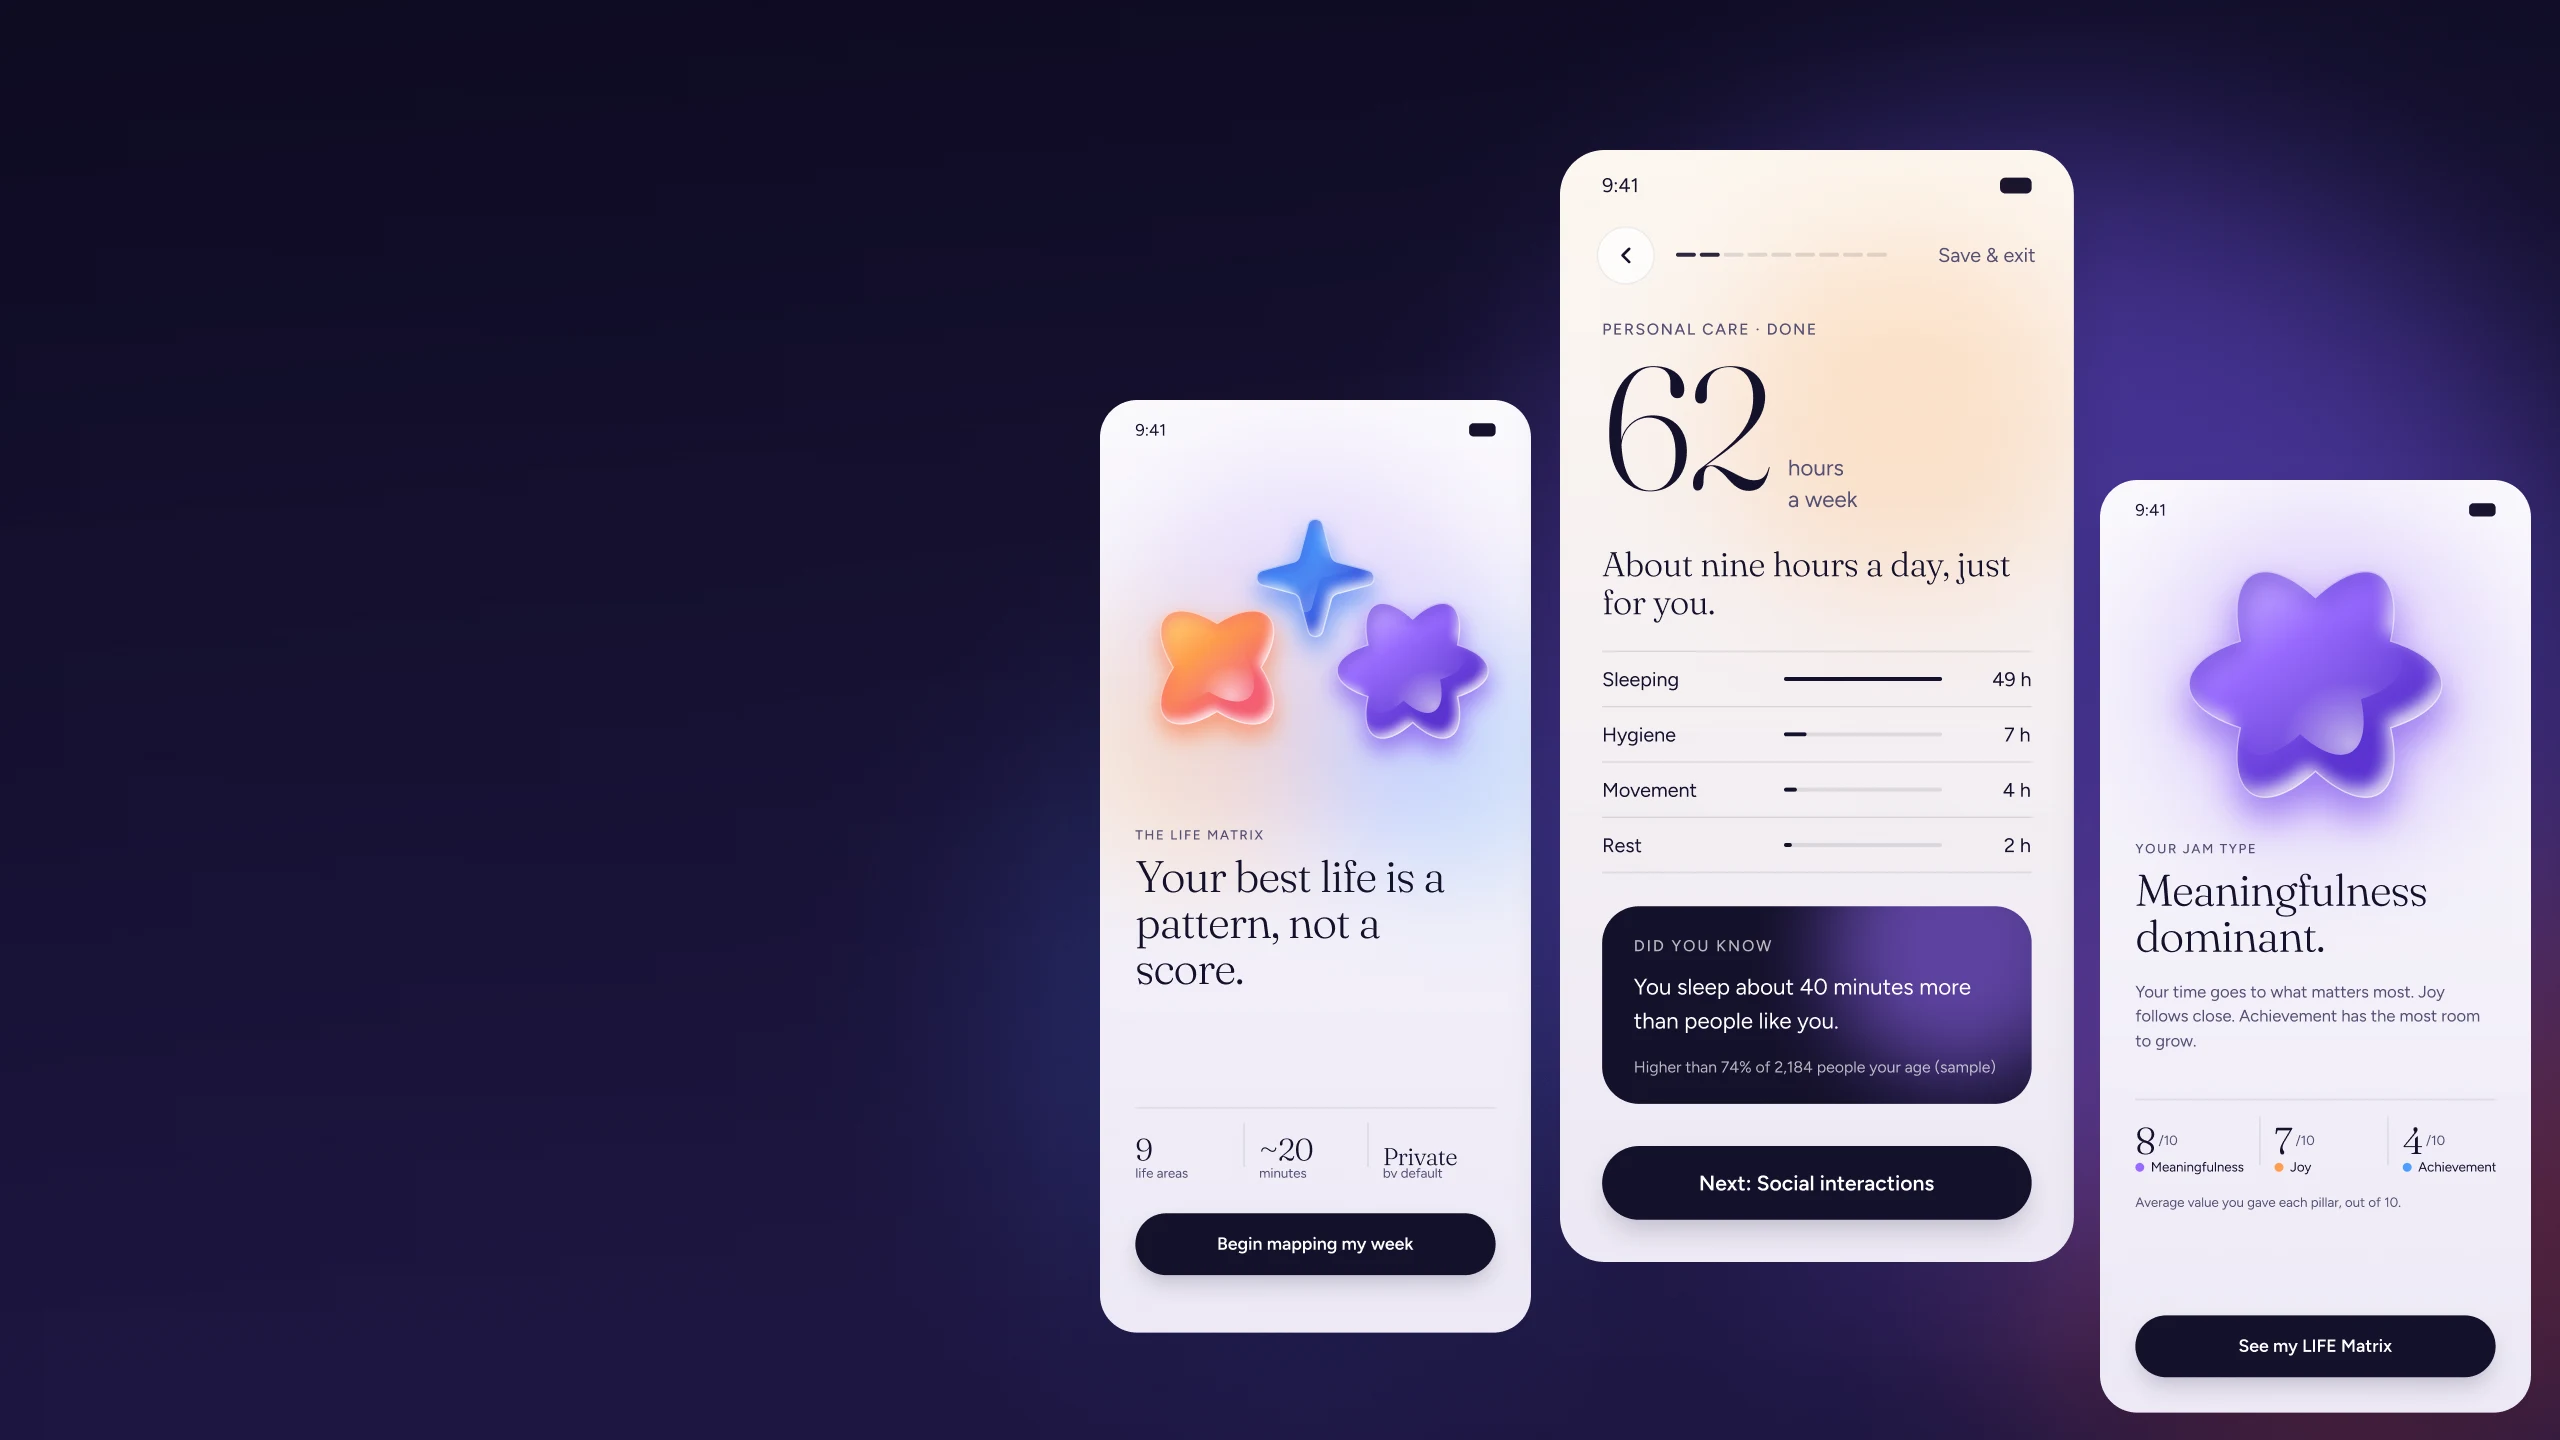
A team of researchers at Harvard Business School built the LIFE Matrix to help people see how they spend their 168 hours a week, and how that time connects to what they value. Their study was done. They wanted to turn it into a tool for the general public.
They are researchers, not product people. So they brought me in as a product designer and experience advisor. I was the only designer, working with HBS researchers and professors, product managers and a large engineering team.
We met every week to define the route, the flows and the frictions. Each of us saw problems from our own field, and we fixed them as we went.
Given
The questions, written by the HBS research team
The life areas and the way answers are read
The LIFE Matrix as the way to show the data
Mine
How the assessment feels from first screen to last
Where people rest, and where they get something back
How people know where they are
How we keep them until the result
Every figure inside the screens on this page is sample data.
The Situation
The assessment asks about every area of a person's week. Then it asks what each activity is worth to them. Our ceiling was 20 minutes. That is a lot to ask from someone who just arrived and has no reason yet to trust the product.
I started from one assumption: some people will always leave. I could not stop that. I could move the moment as late as possible, and I could make sure we caught people when they went.
CORE TENSIONS
TENSION 01.
Depth without fatigue
A long run of similar questions is monotone. A tired person answers worse, or stops. The science needed the depth, so the experience had to carry it.
TENSION 02.
Drop-off I could not stop
Some people always leave. The job was to move that moment late, and to catch them when it happens.
TENSION 03.
Trust before time
A new visitor has no reason yet to give 20 minutes to a product they just met. The first screens had to earn that.
The Idea
Most advice says remove friction. For a form this long, that was not enough. I added steps on purpose, and gave each one a job.
More clicks, less fatigue. Between blocks of questions I placed moments that break the pattern. A person reads something interesting, sees where they stand, and gets a reason to keep going. I call it friction with a job.
The Rhythm Map
Each column is a stretch of the assessment. The bar shows how much thinking I ask for. The marker above it shows what I give back. Pick a column, then flip the screen between the ask and the give back.
Get started
Time, by area
Check
Values
Reward
Effort I ask for
Pause
Checkpoint
Reward
Hours, one decision
Personal care
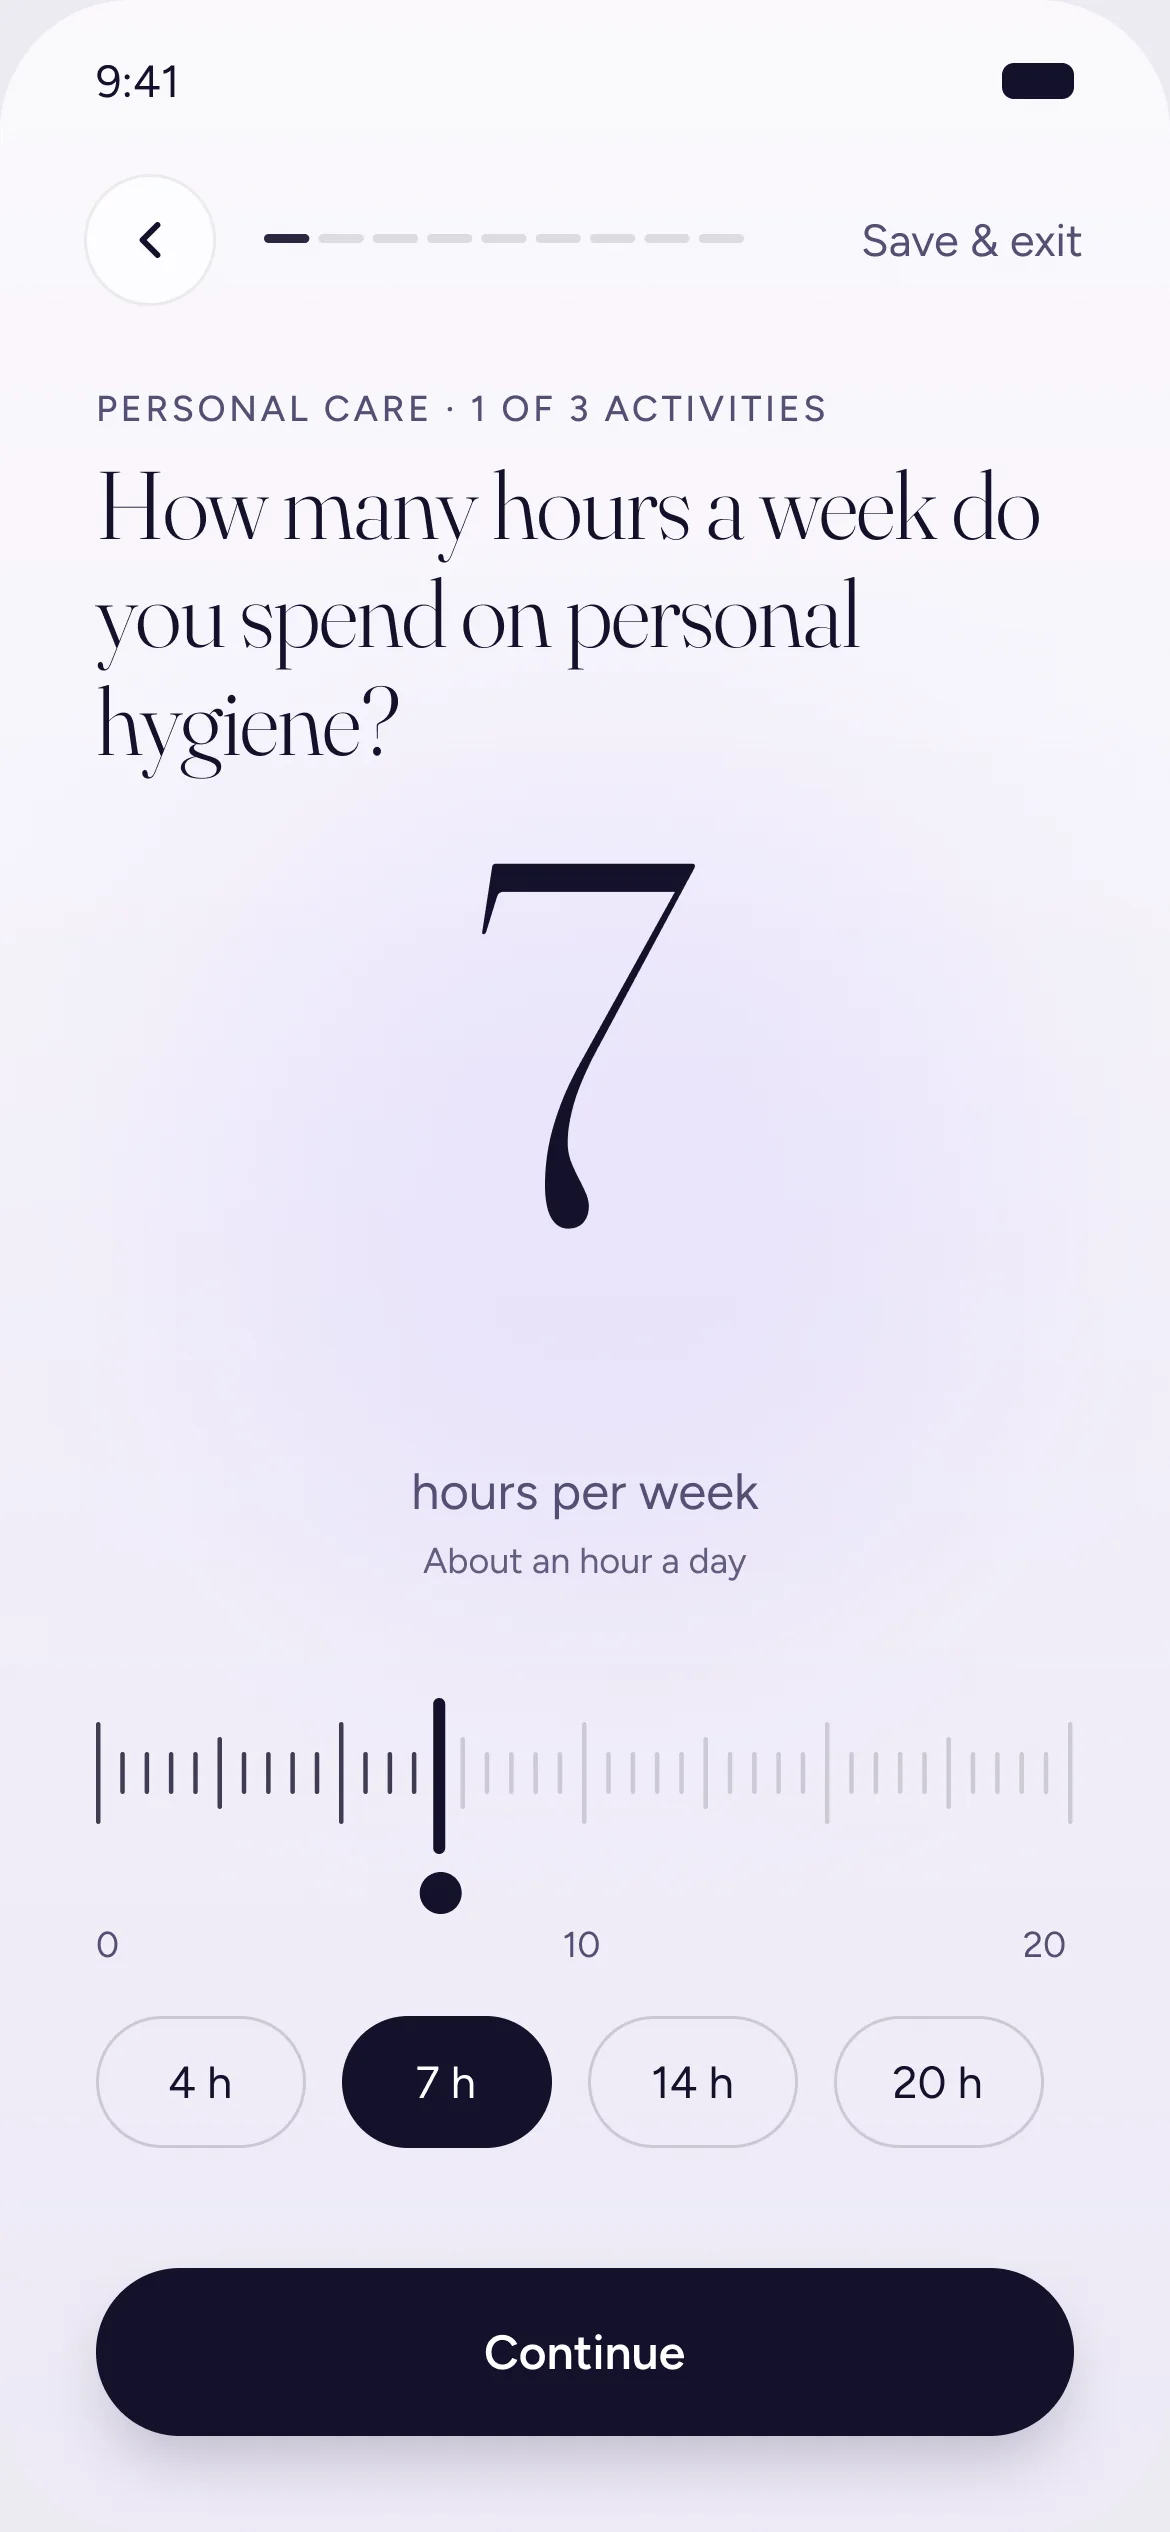
Stop 4 of 13 · Time, by area
What I ask
Hours per activity, one screen at a time.
What I give back
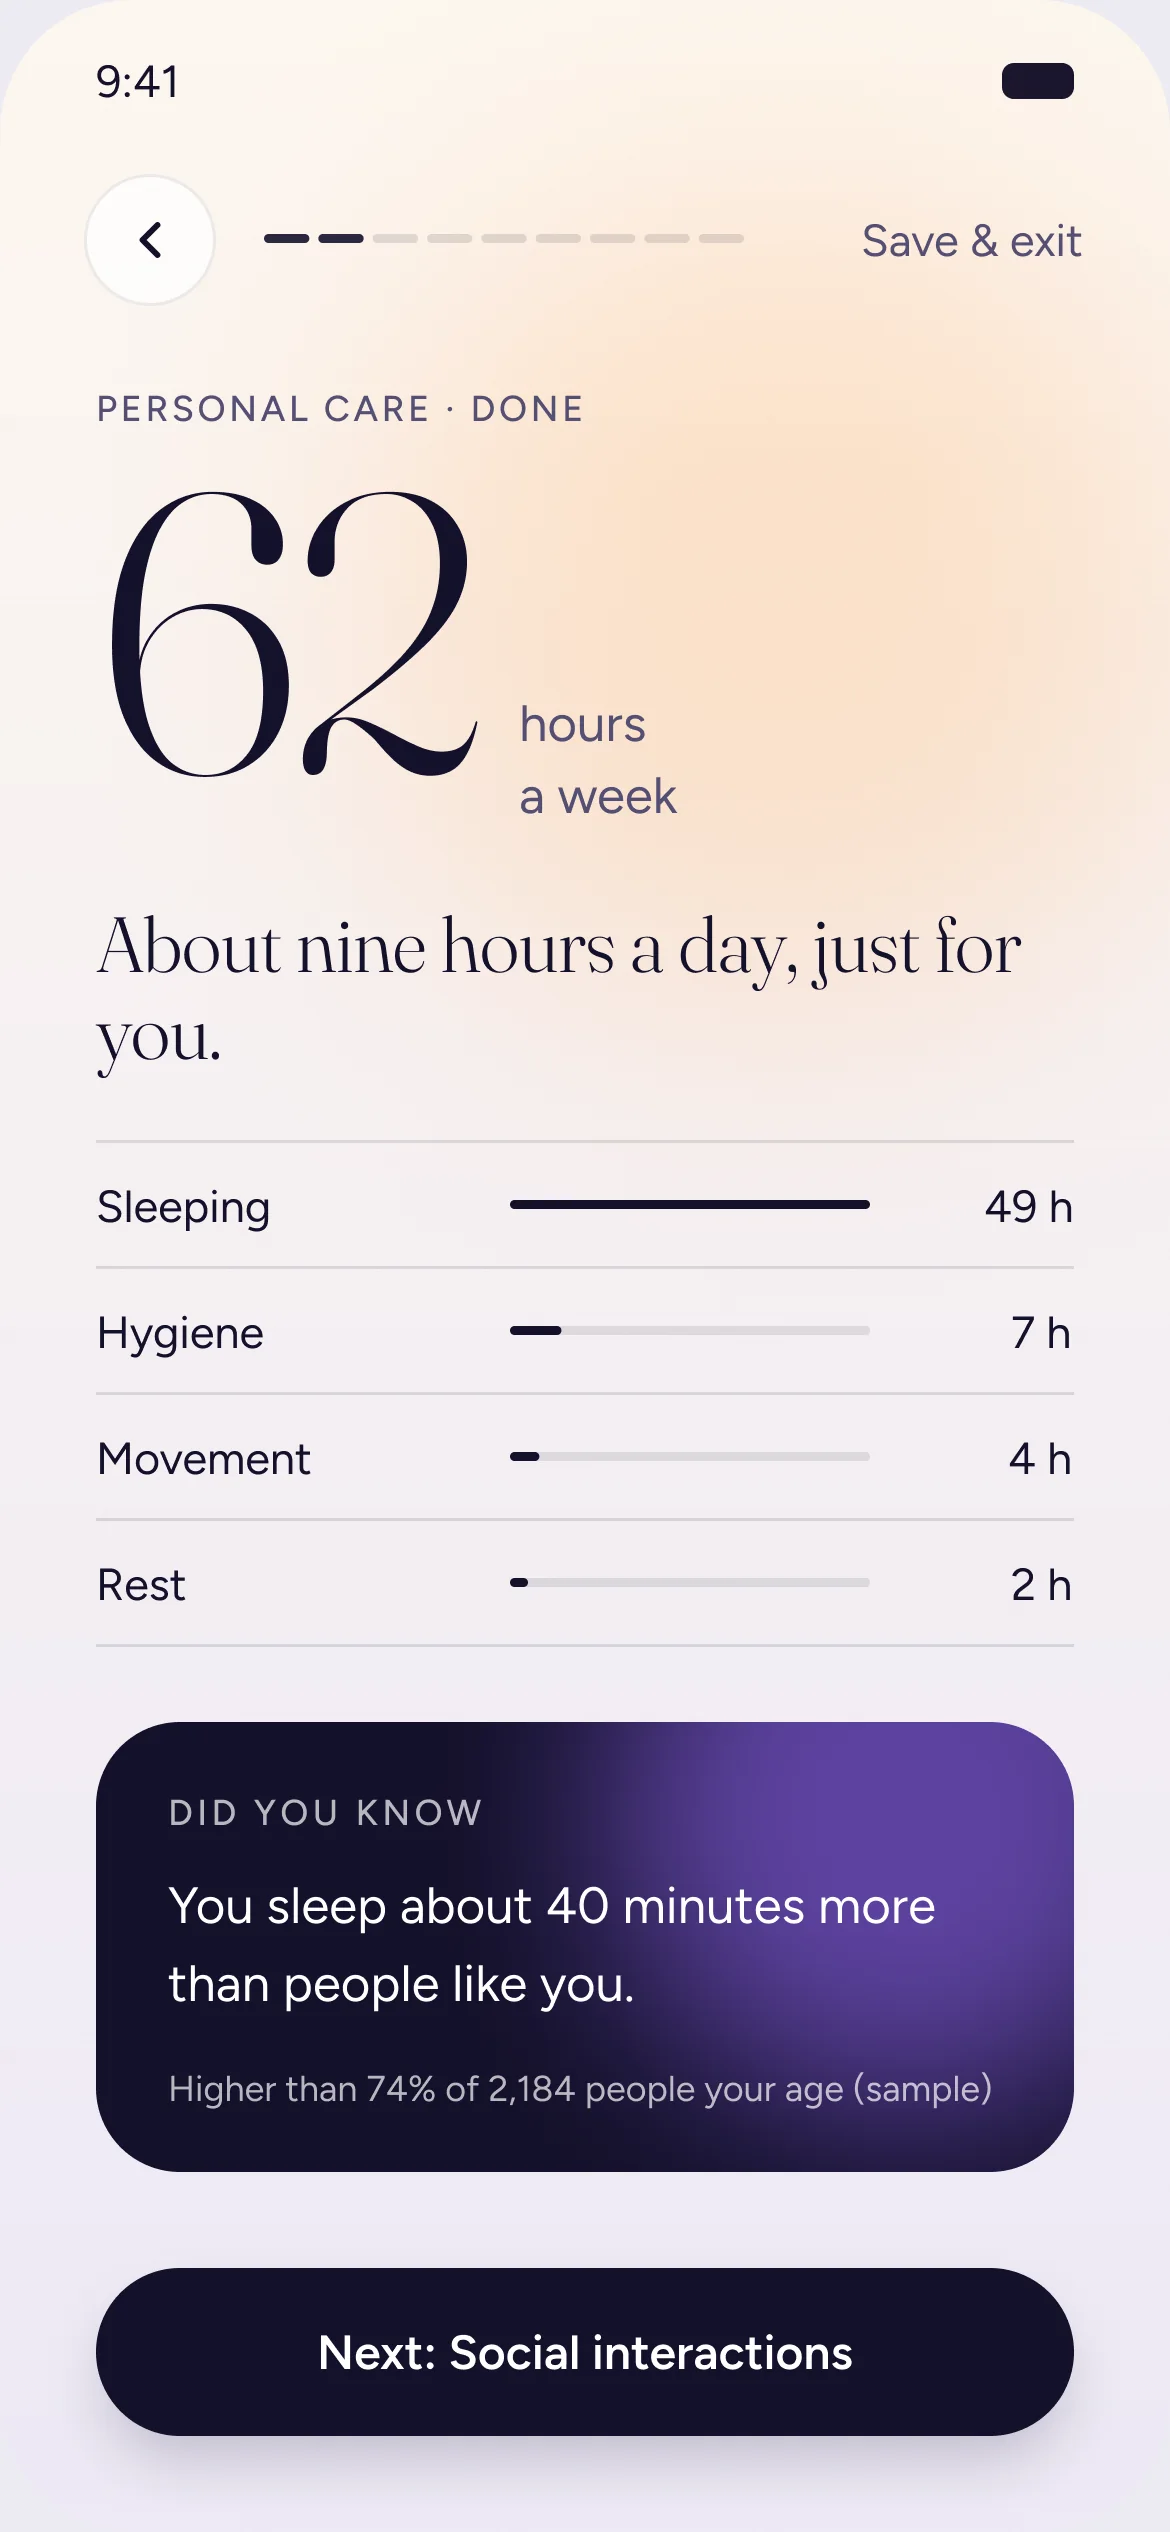
A Did you know. Top quarter for exercise? They see that. If not, they see how their sleep compares.
Why it is here
The first pause teaches the pattern: do some work, get something back.
Effort levels are design intent, not measured data. The sequence comes from the original HBS flow.
Decisions
None of these is a visual decision. They are choices about order, focus and reward. Two of them are easier to feel than to read, so you can play with them.
Focus
One decision per screen.
I wanted people to look at one thing and answer it. Showing a whole block at once makes the work look bigger than it is. Step by step keeps the mind on the question in front, and tiredness grows more slowly.
Cheap to answer. Activities are chips. Hours come from a ruler with quick picks. The copy says a rough guess is fine. Nobody has to be exact to move on.
Orientation
What do you show, and what do you promise?
People need to know where they are without being told how much is left. I tested three ways to show it.
Bar only
“Something is moving.”
A simple bar shows that things are moving and never makes a promise we cannot keep. It gives the person a sense of place without a number to measure the effort against.
What the person thinks when they see it. Question numbers shown here are for illustration.
Pauses
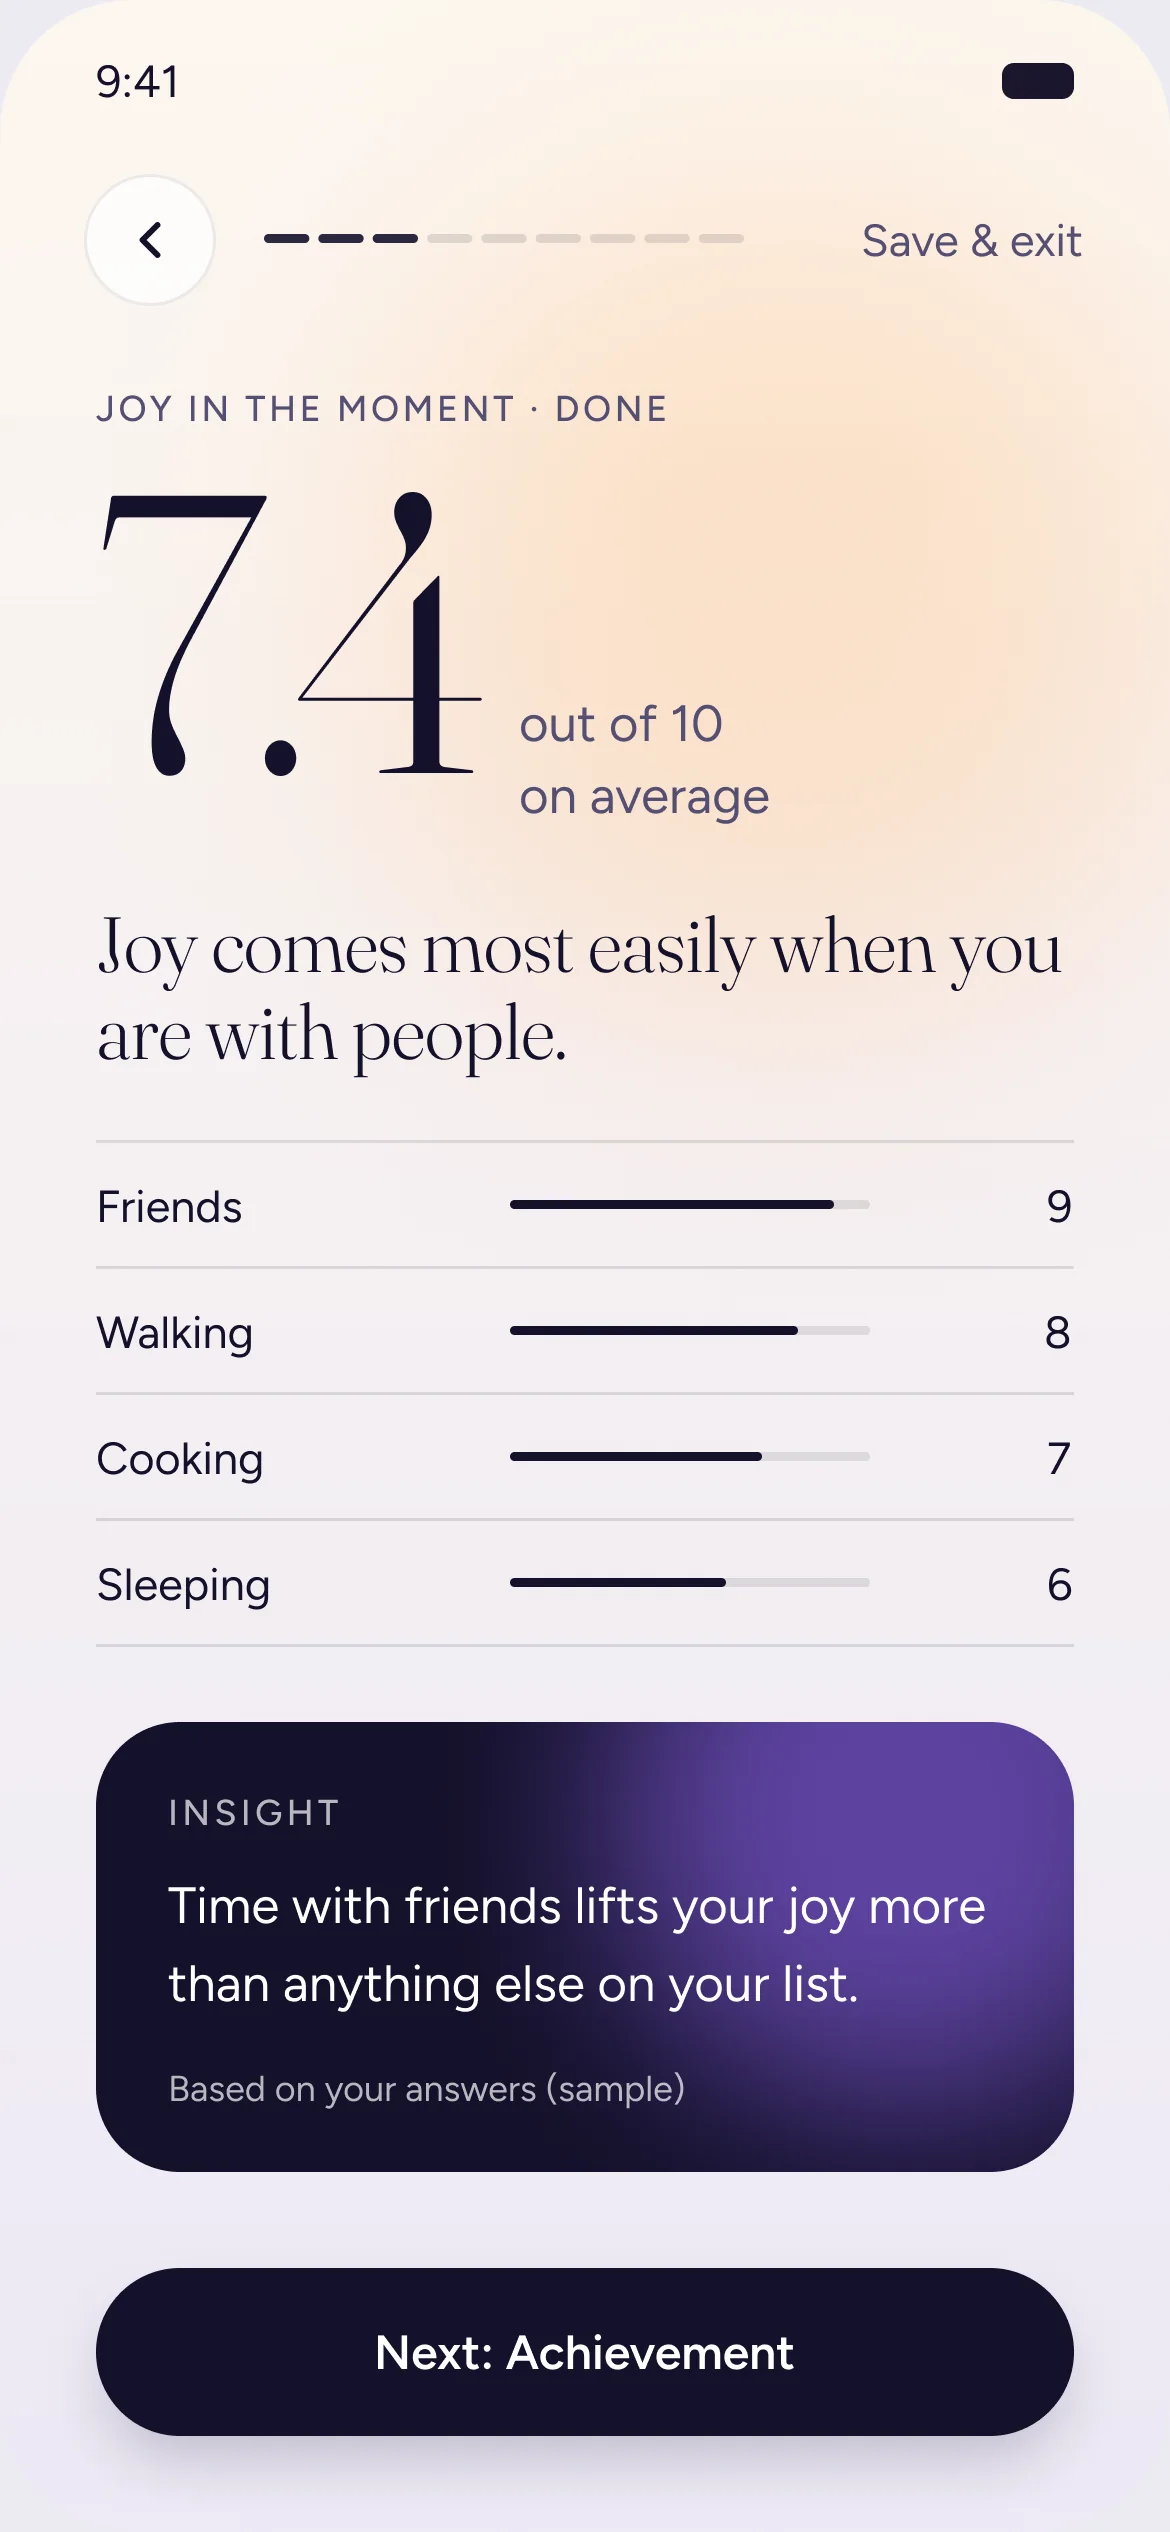
A Did you know after every area.
It breaks the pattern of answering. It also hooks the person with something they care about: how they compare with others. People measure themselves against groups. It happens on its own, and it gives a reason to keep going until the result.
Data first
Demographics before time.
Without them we cannot compare anyone with people like them, and the whole product depends on that comparison. Asking early also means we have the person's details if they leave.
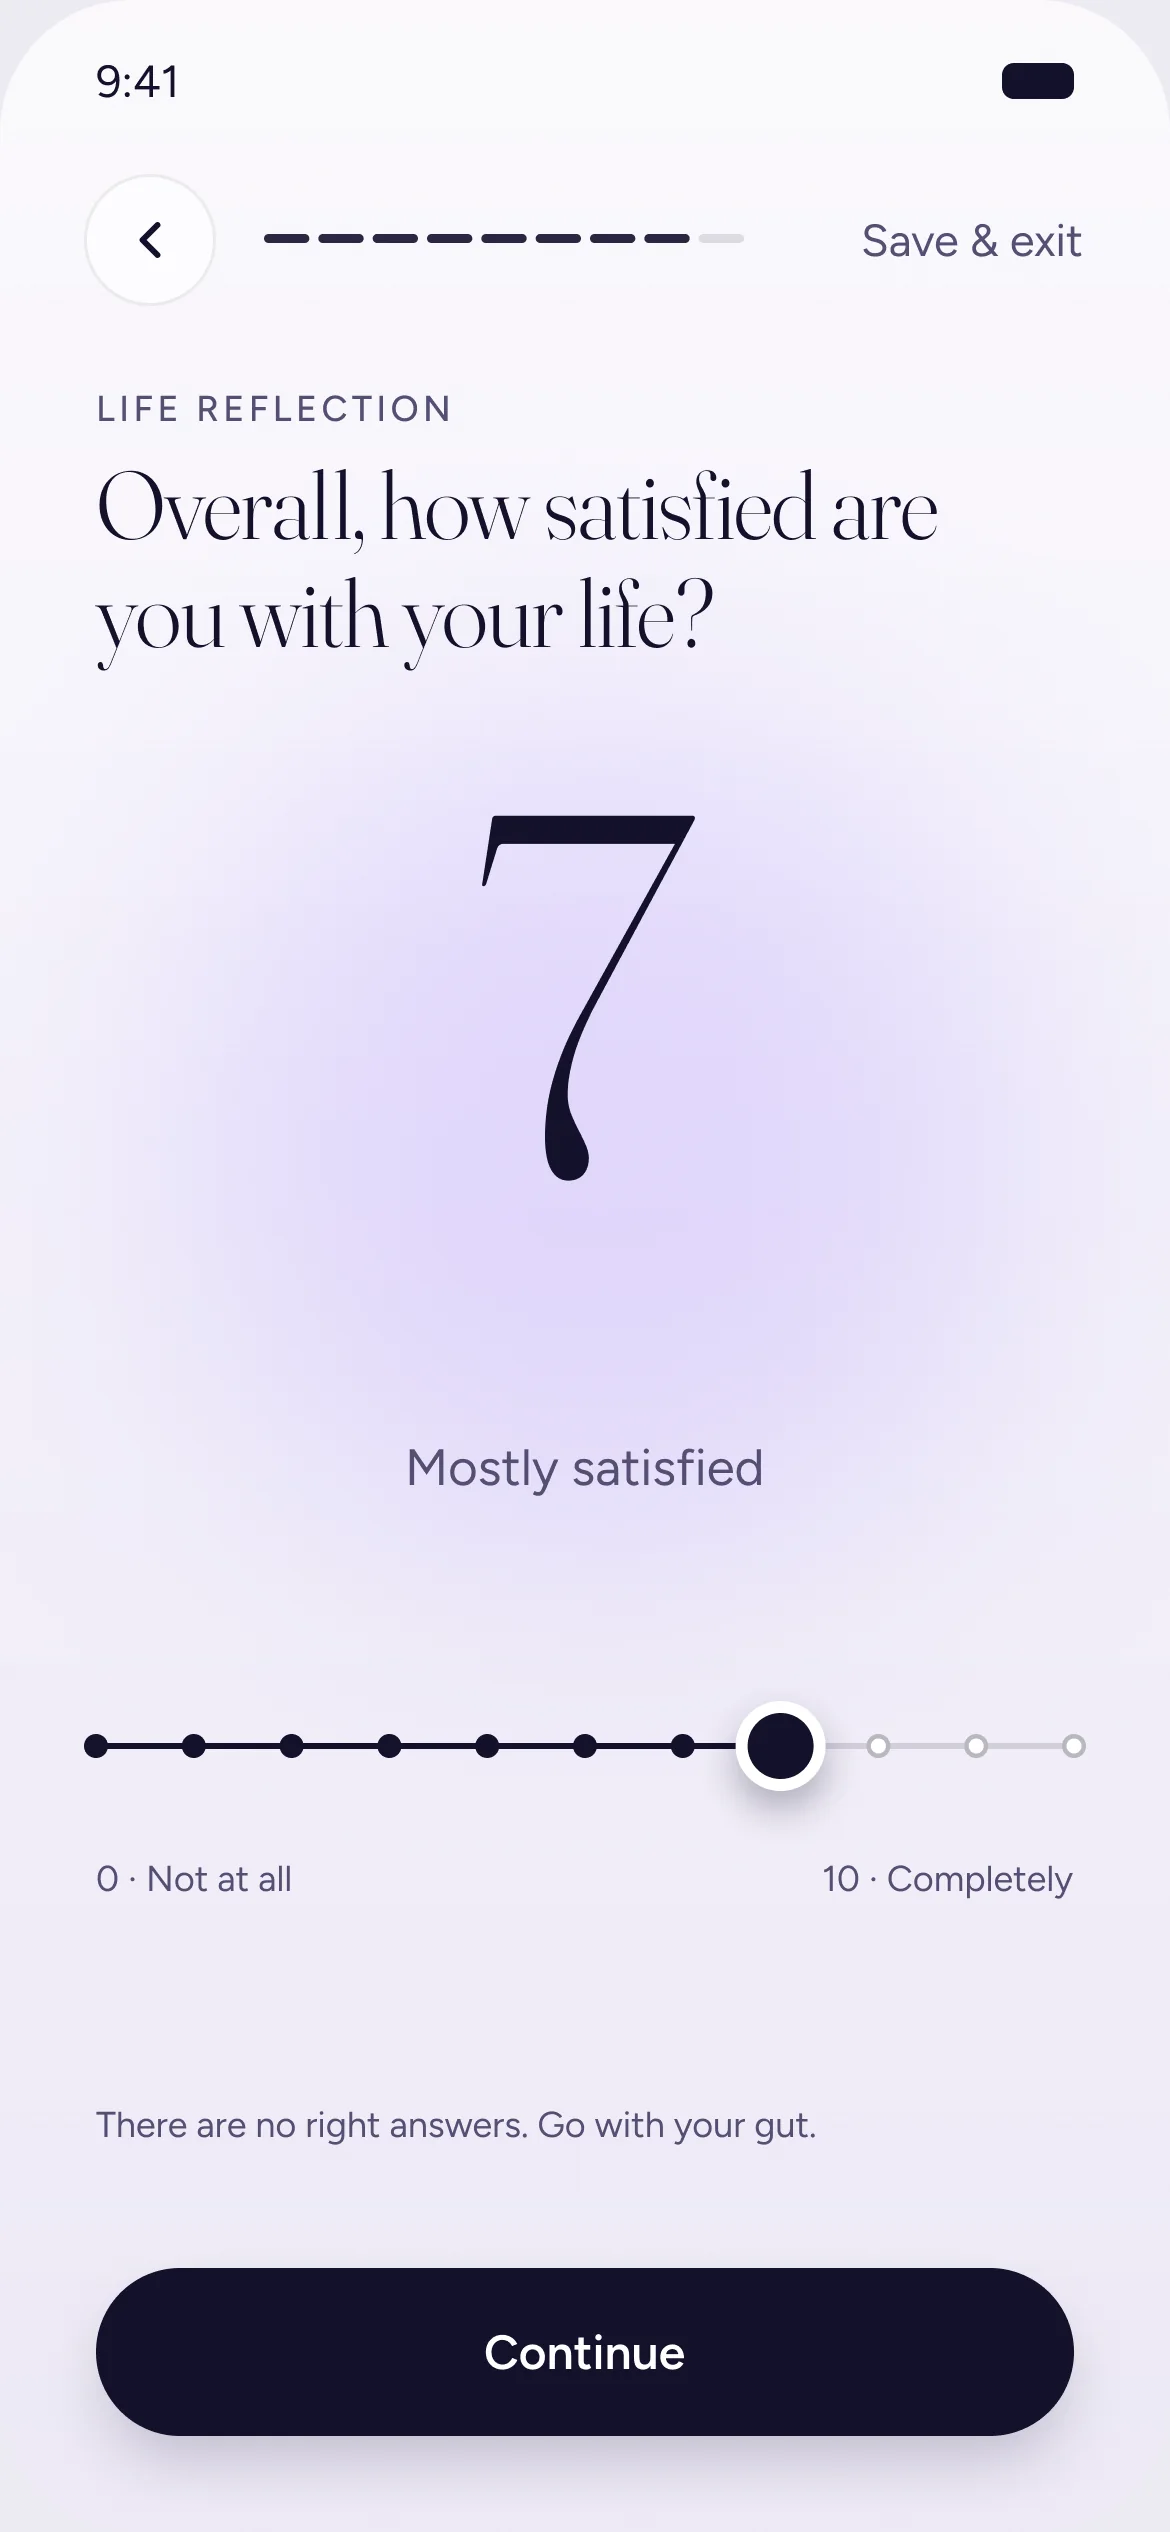
Heavy part
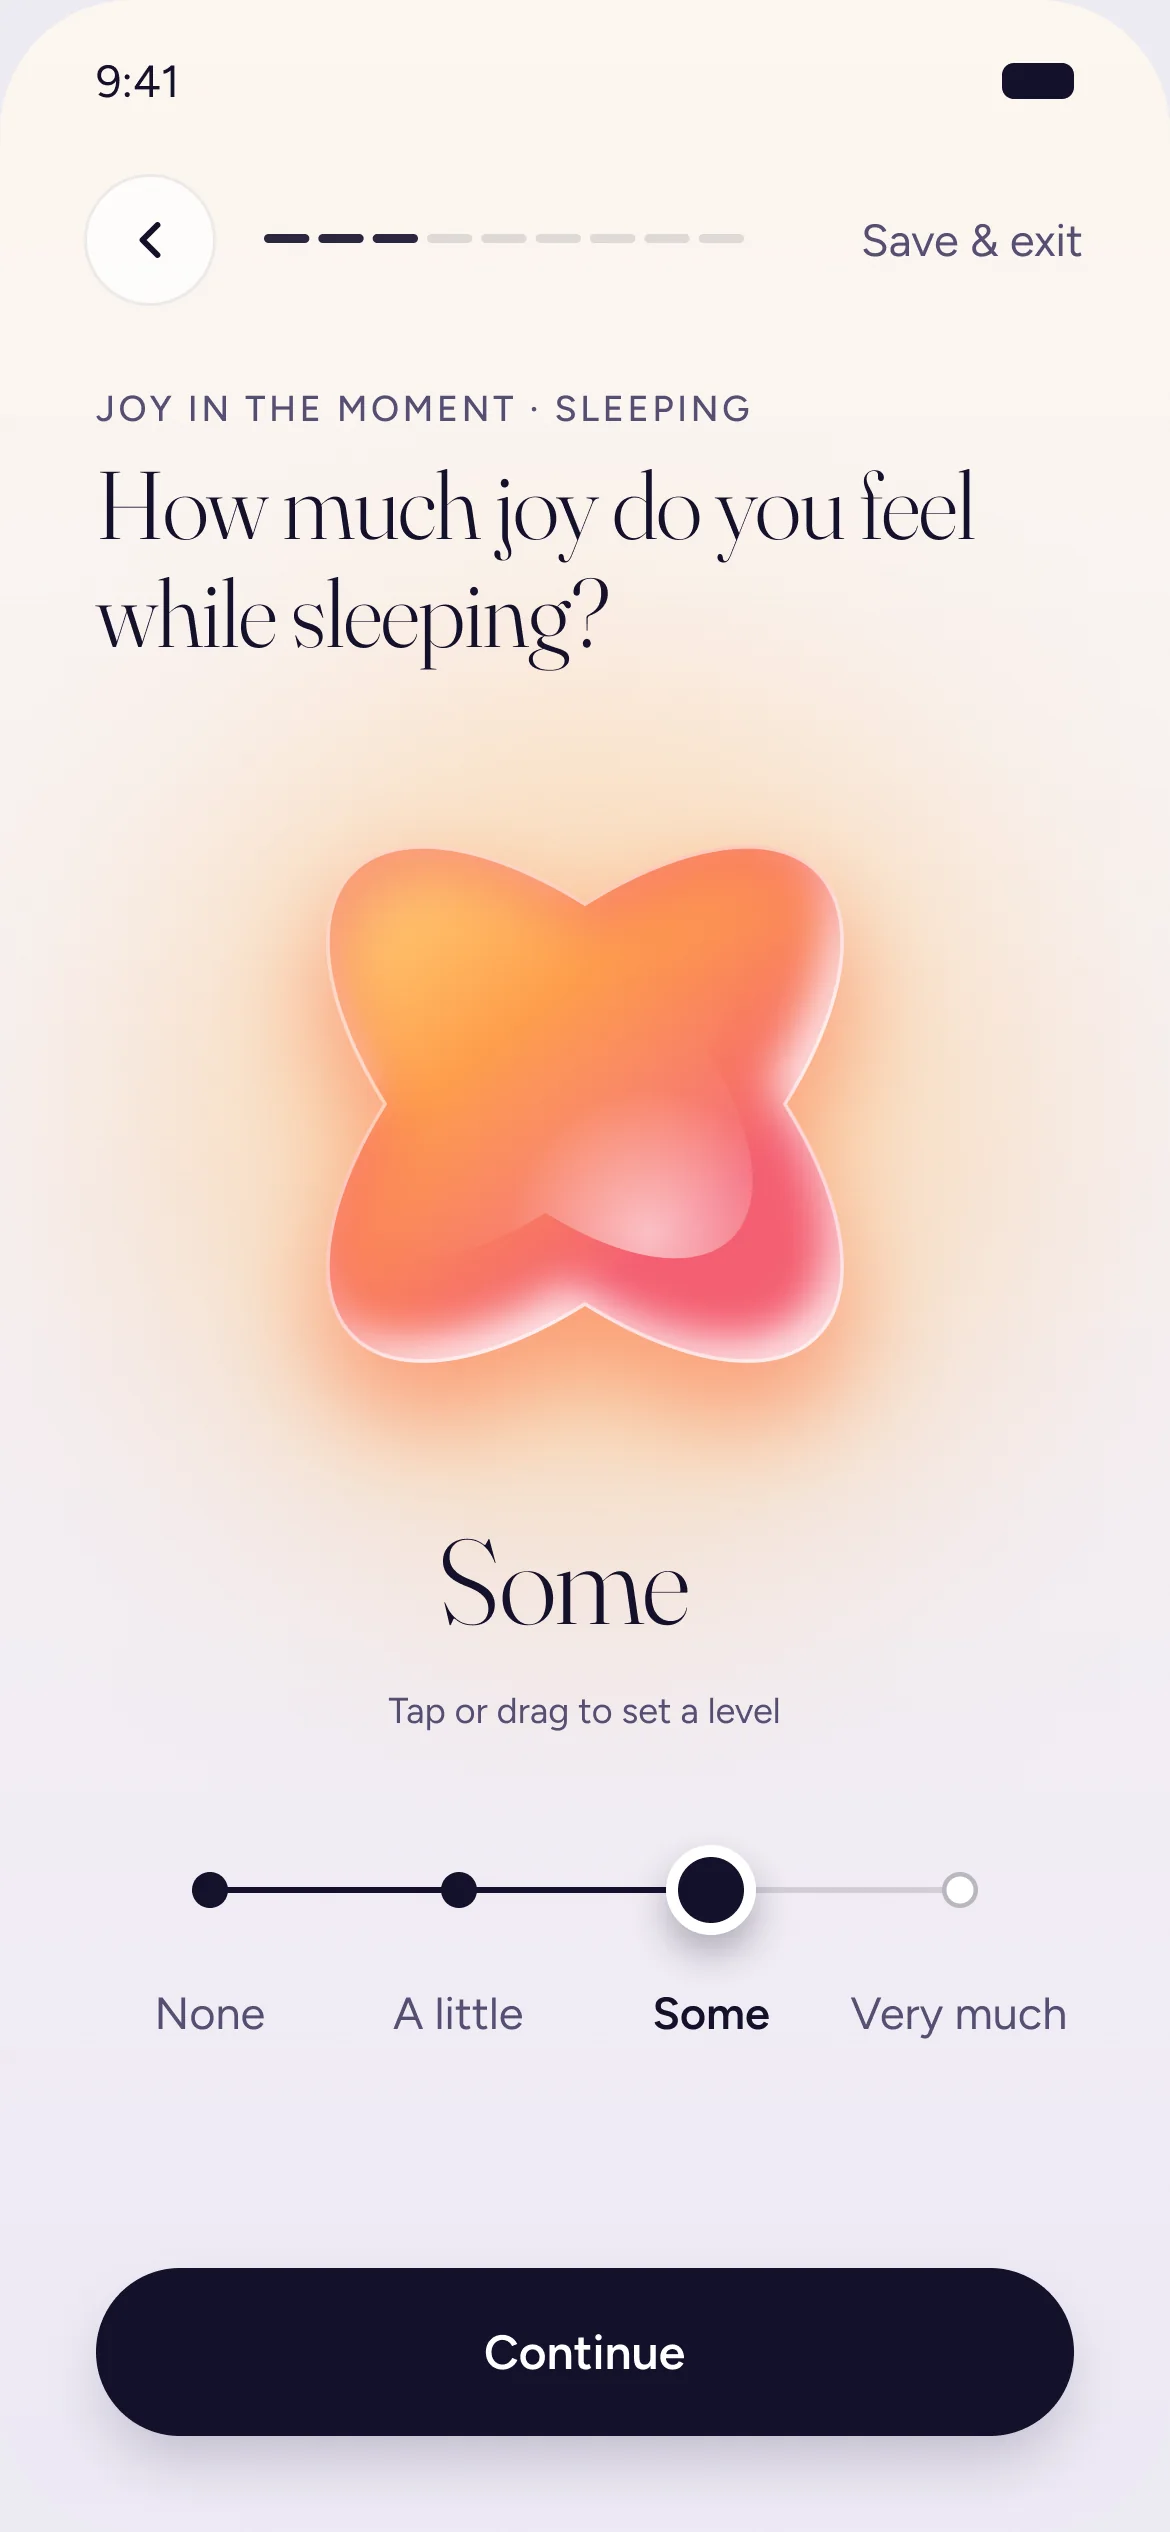
The hardest questions get the most care.
Asking how much joy, achievement and meaning each activity gives is the heaviest thinking in the assessment. So this is where the pauses sit closest together: short insights inside the block, and a slower life reflection right before the result.
Safety nets
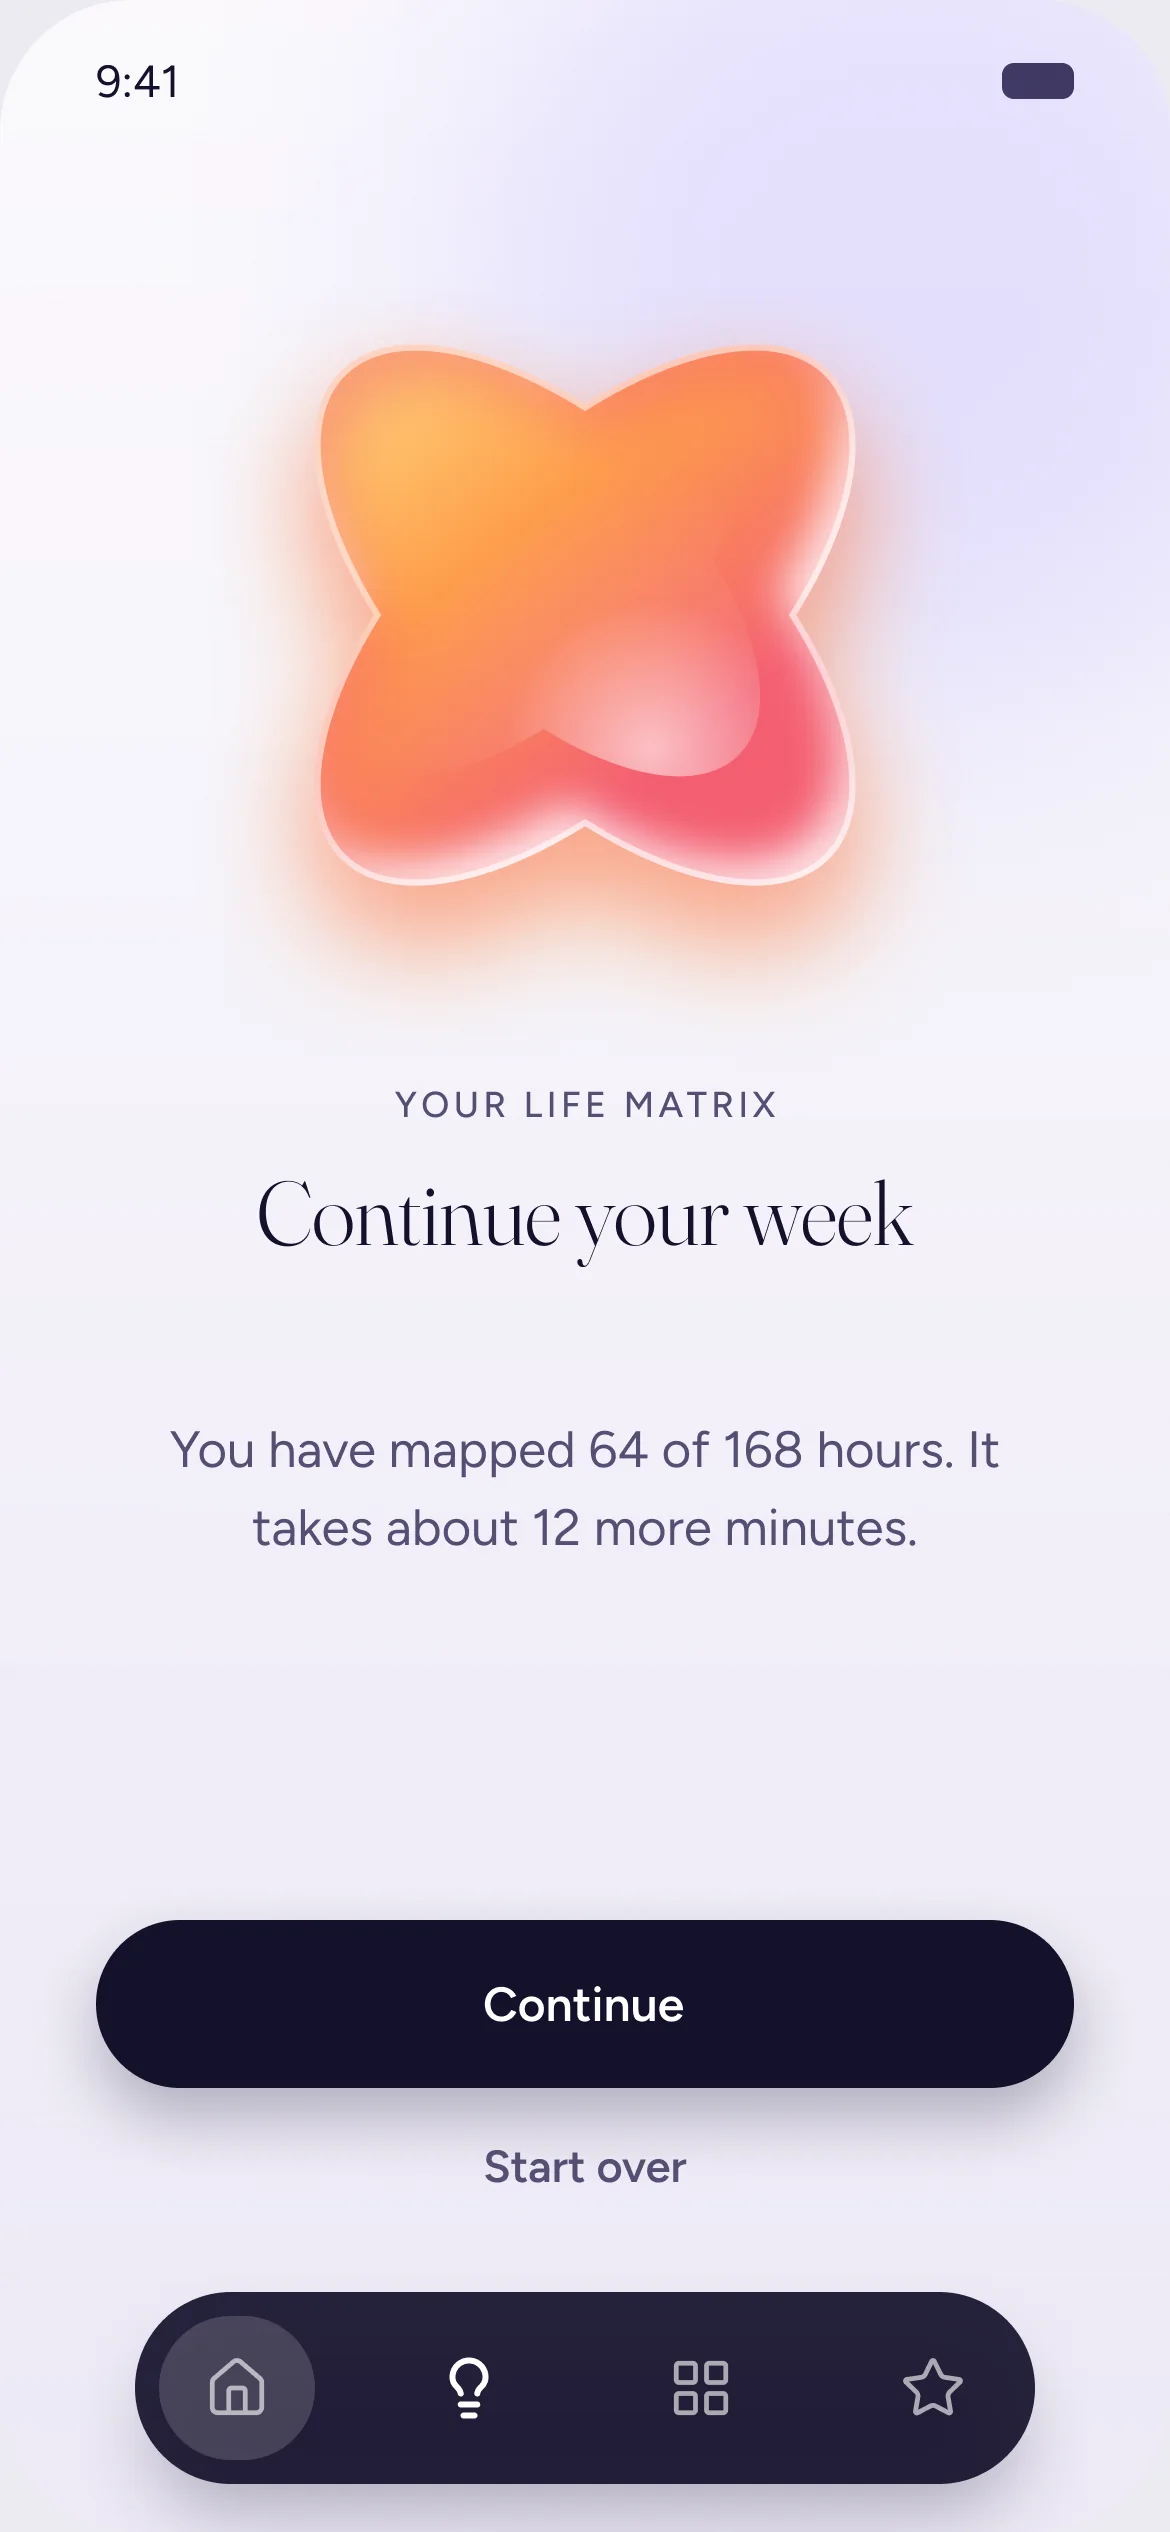
We expected drop-off, so we built for it.
Details are captured right after the first questions. An abandoned state on Home lets people pick up where they stopped. Reminders by email and notifications from the app bring people back to finish.
Layers
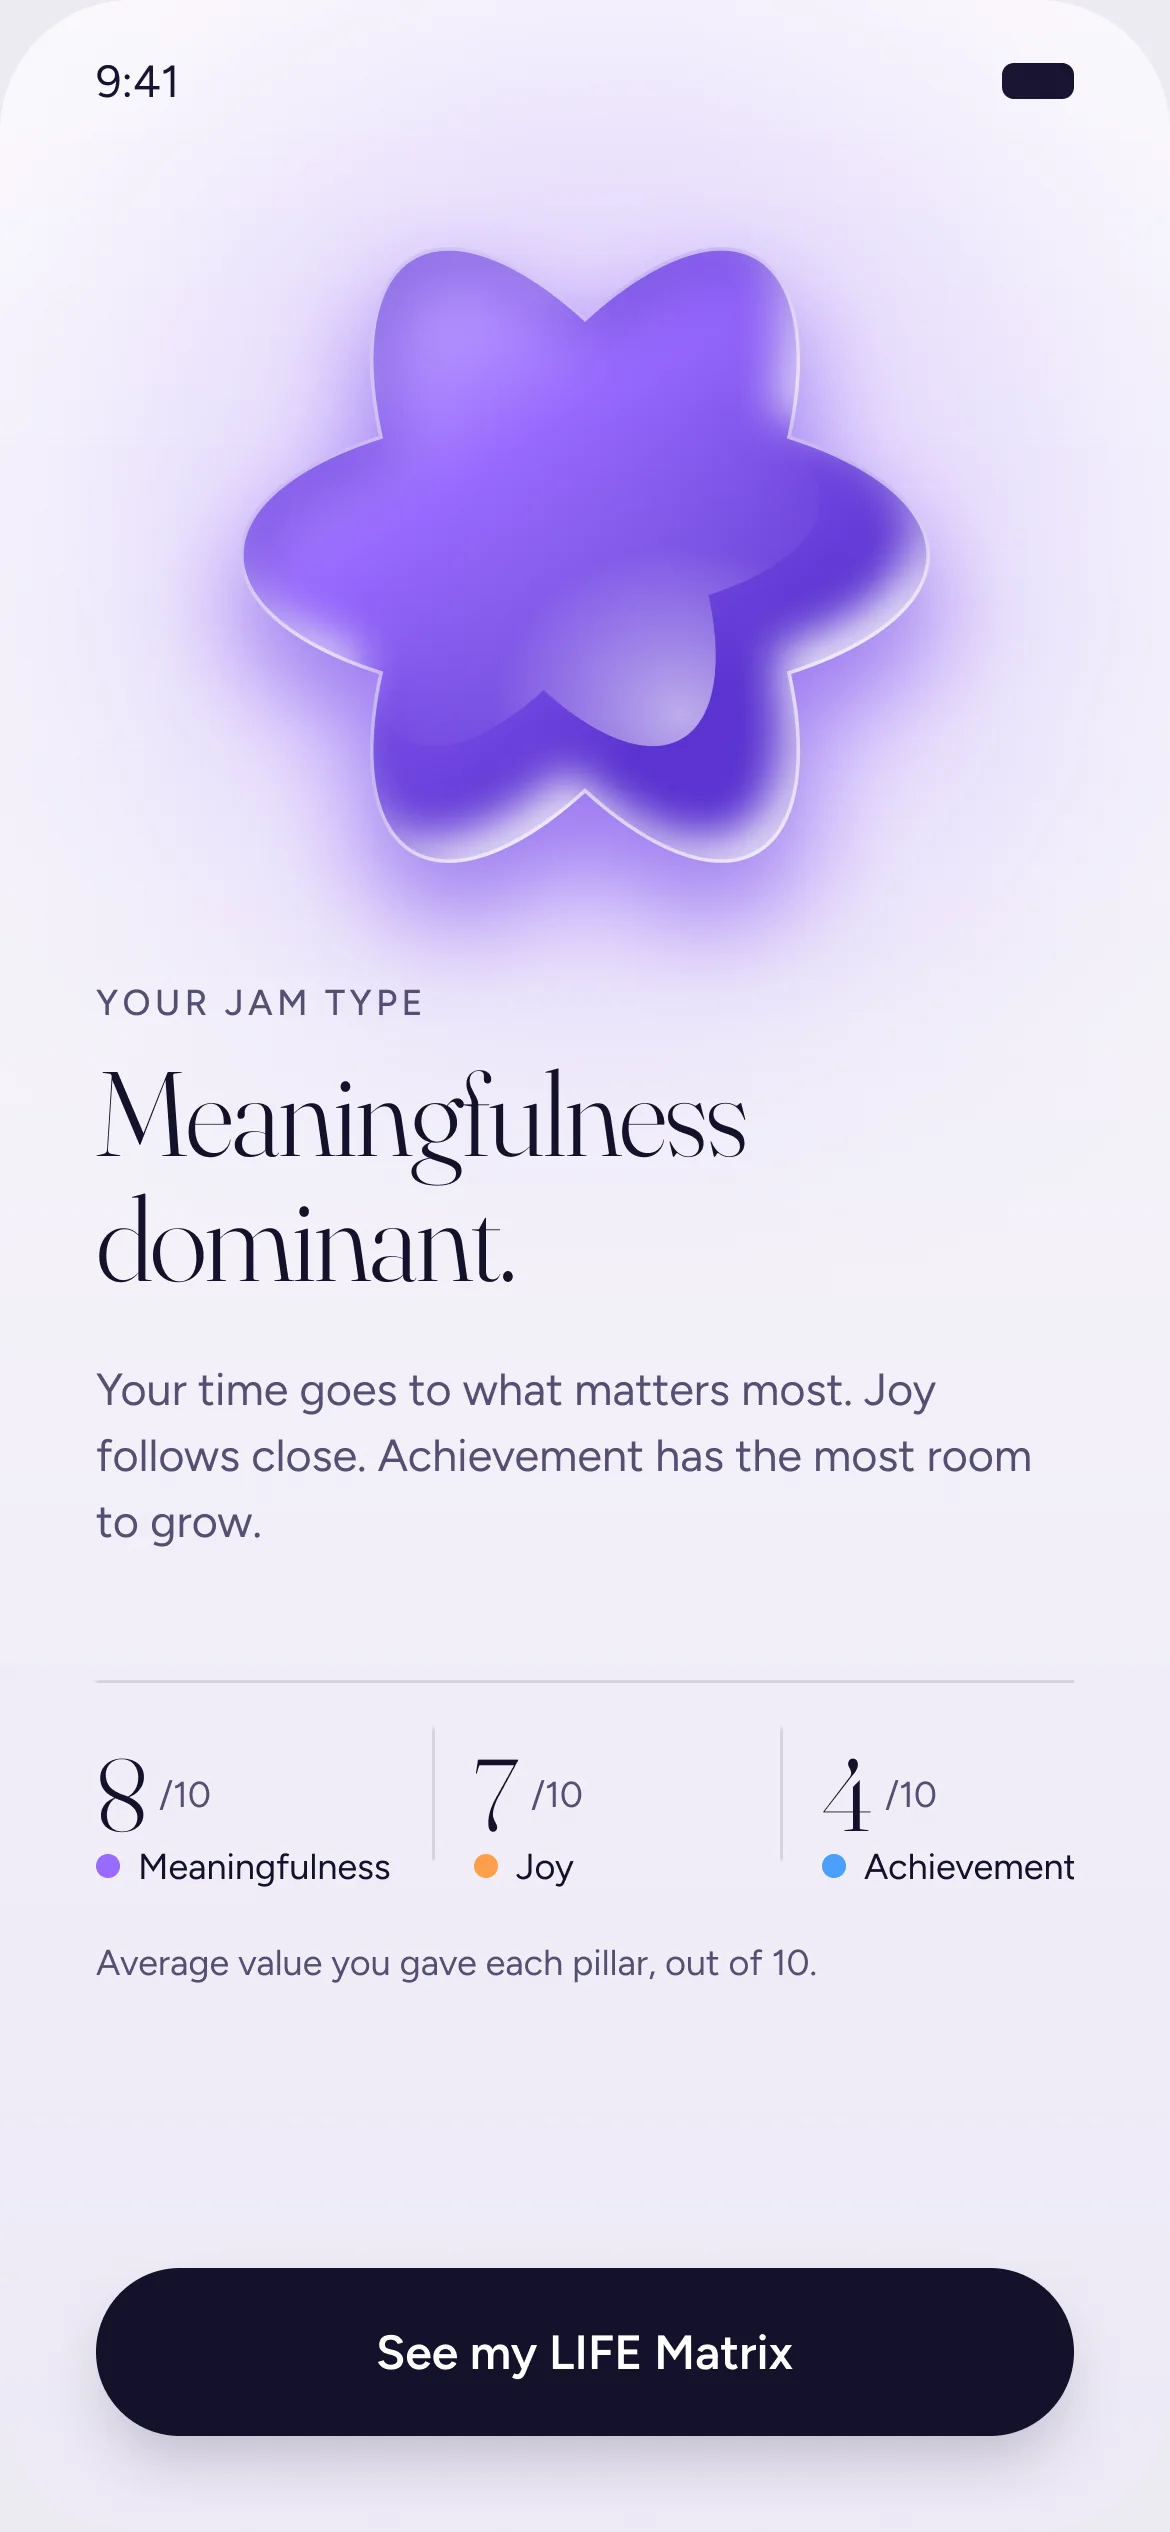
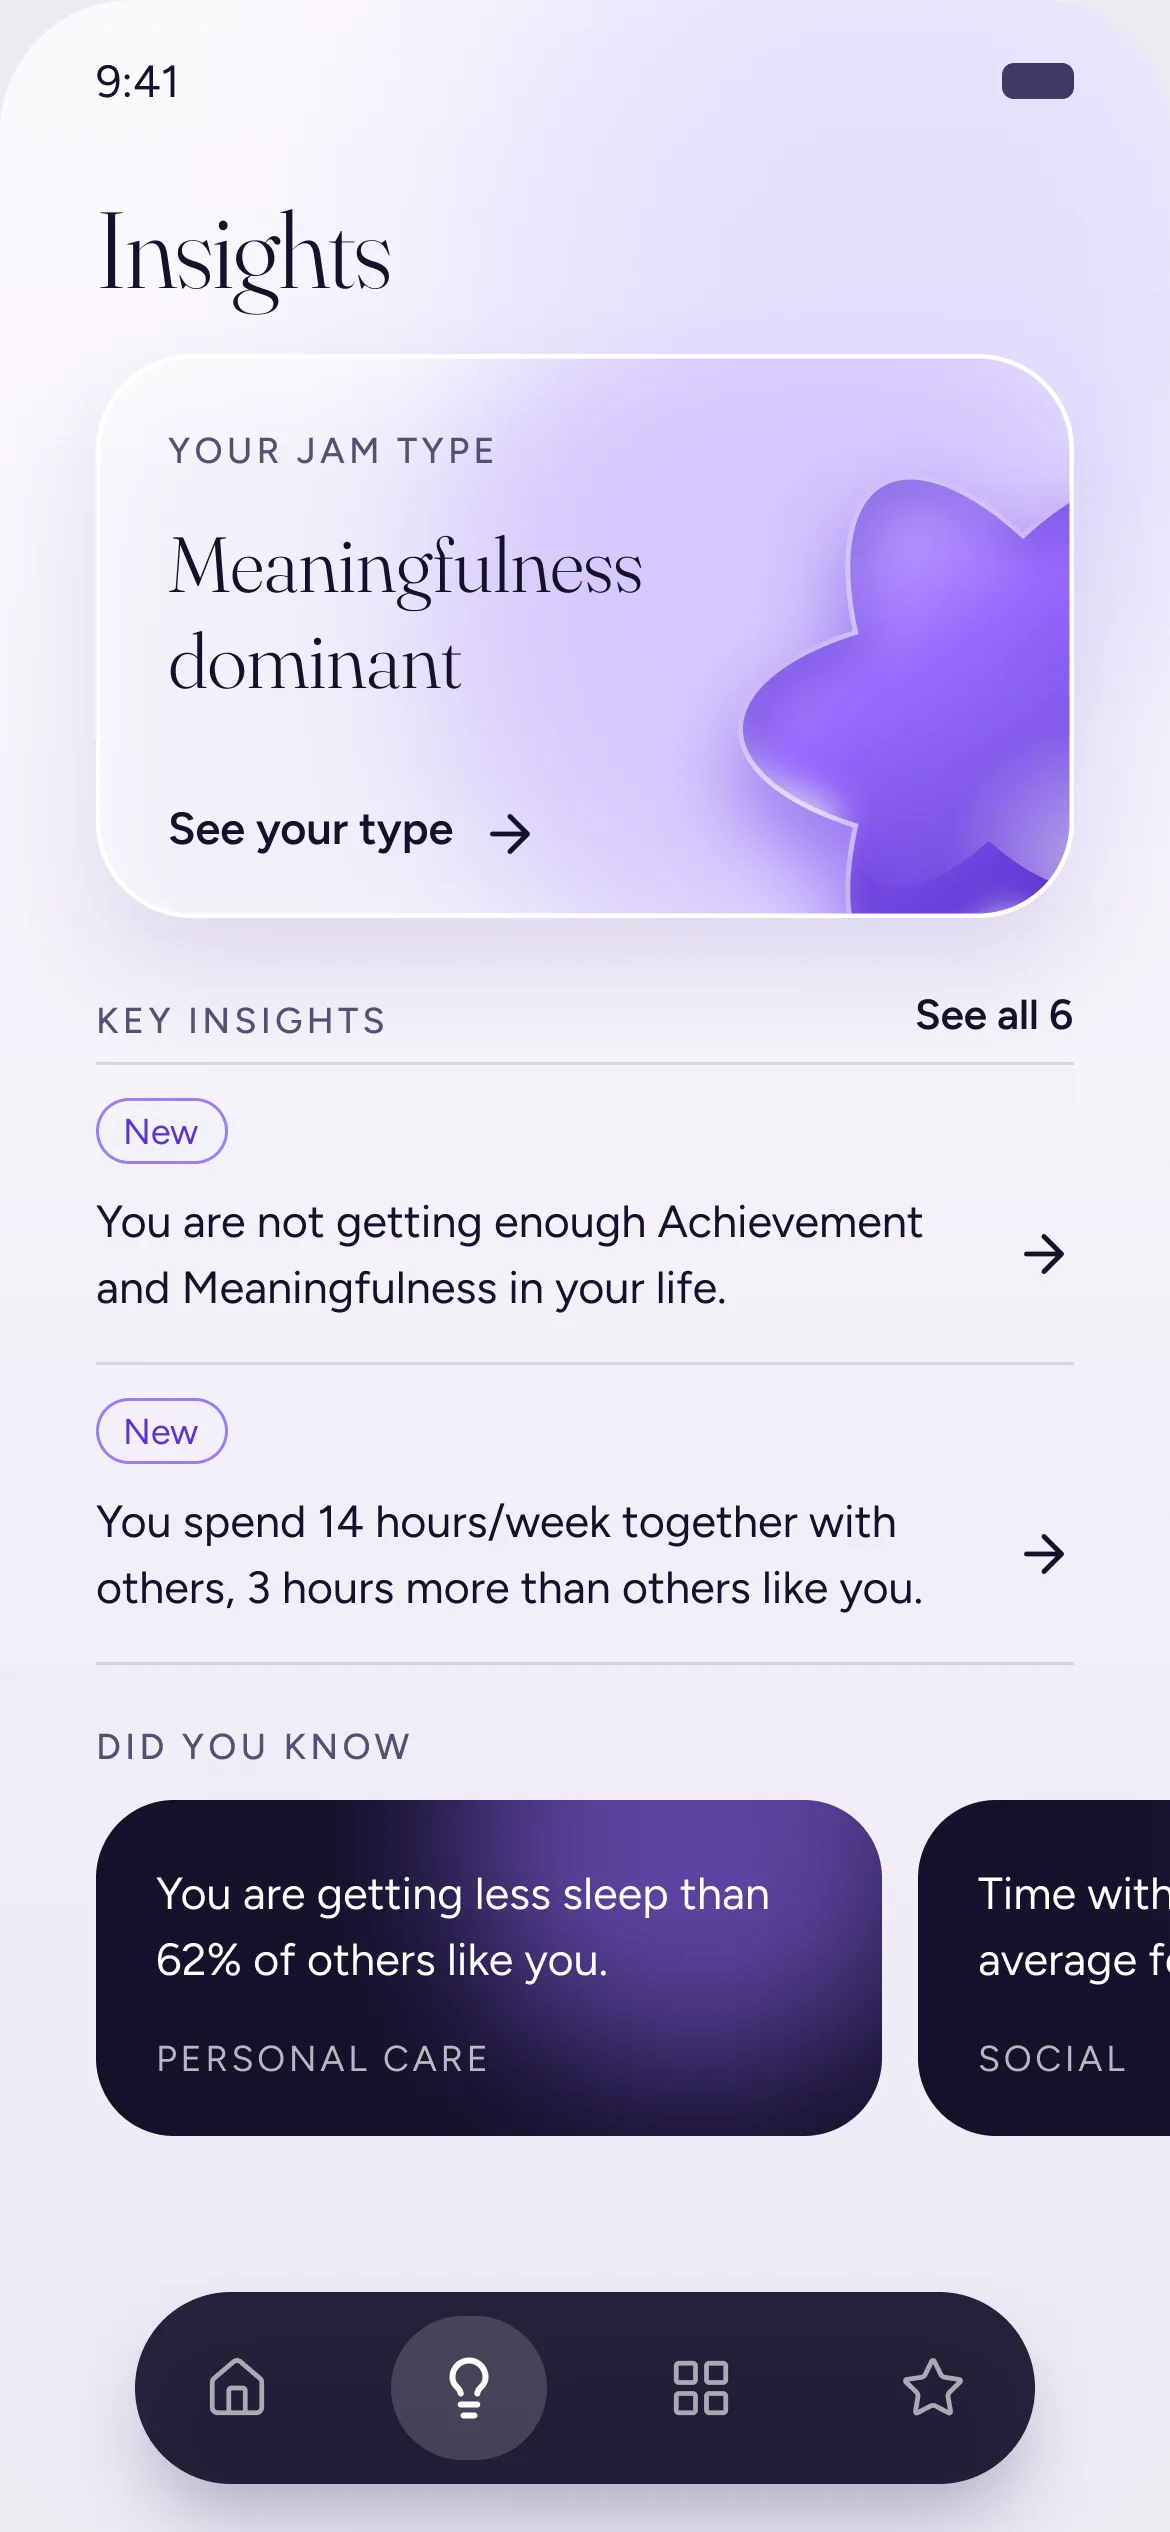
Results arrive in layers.
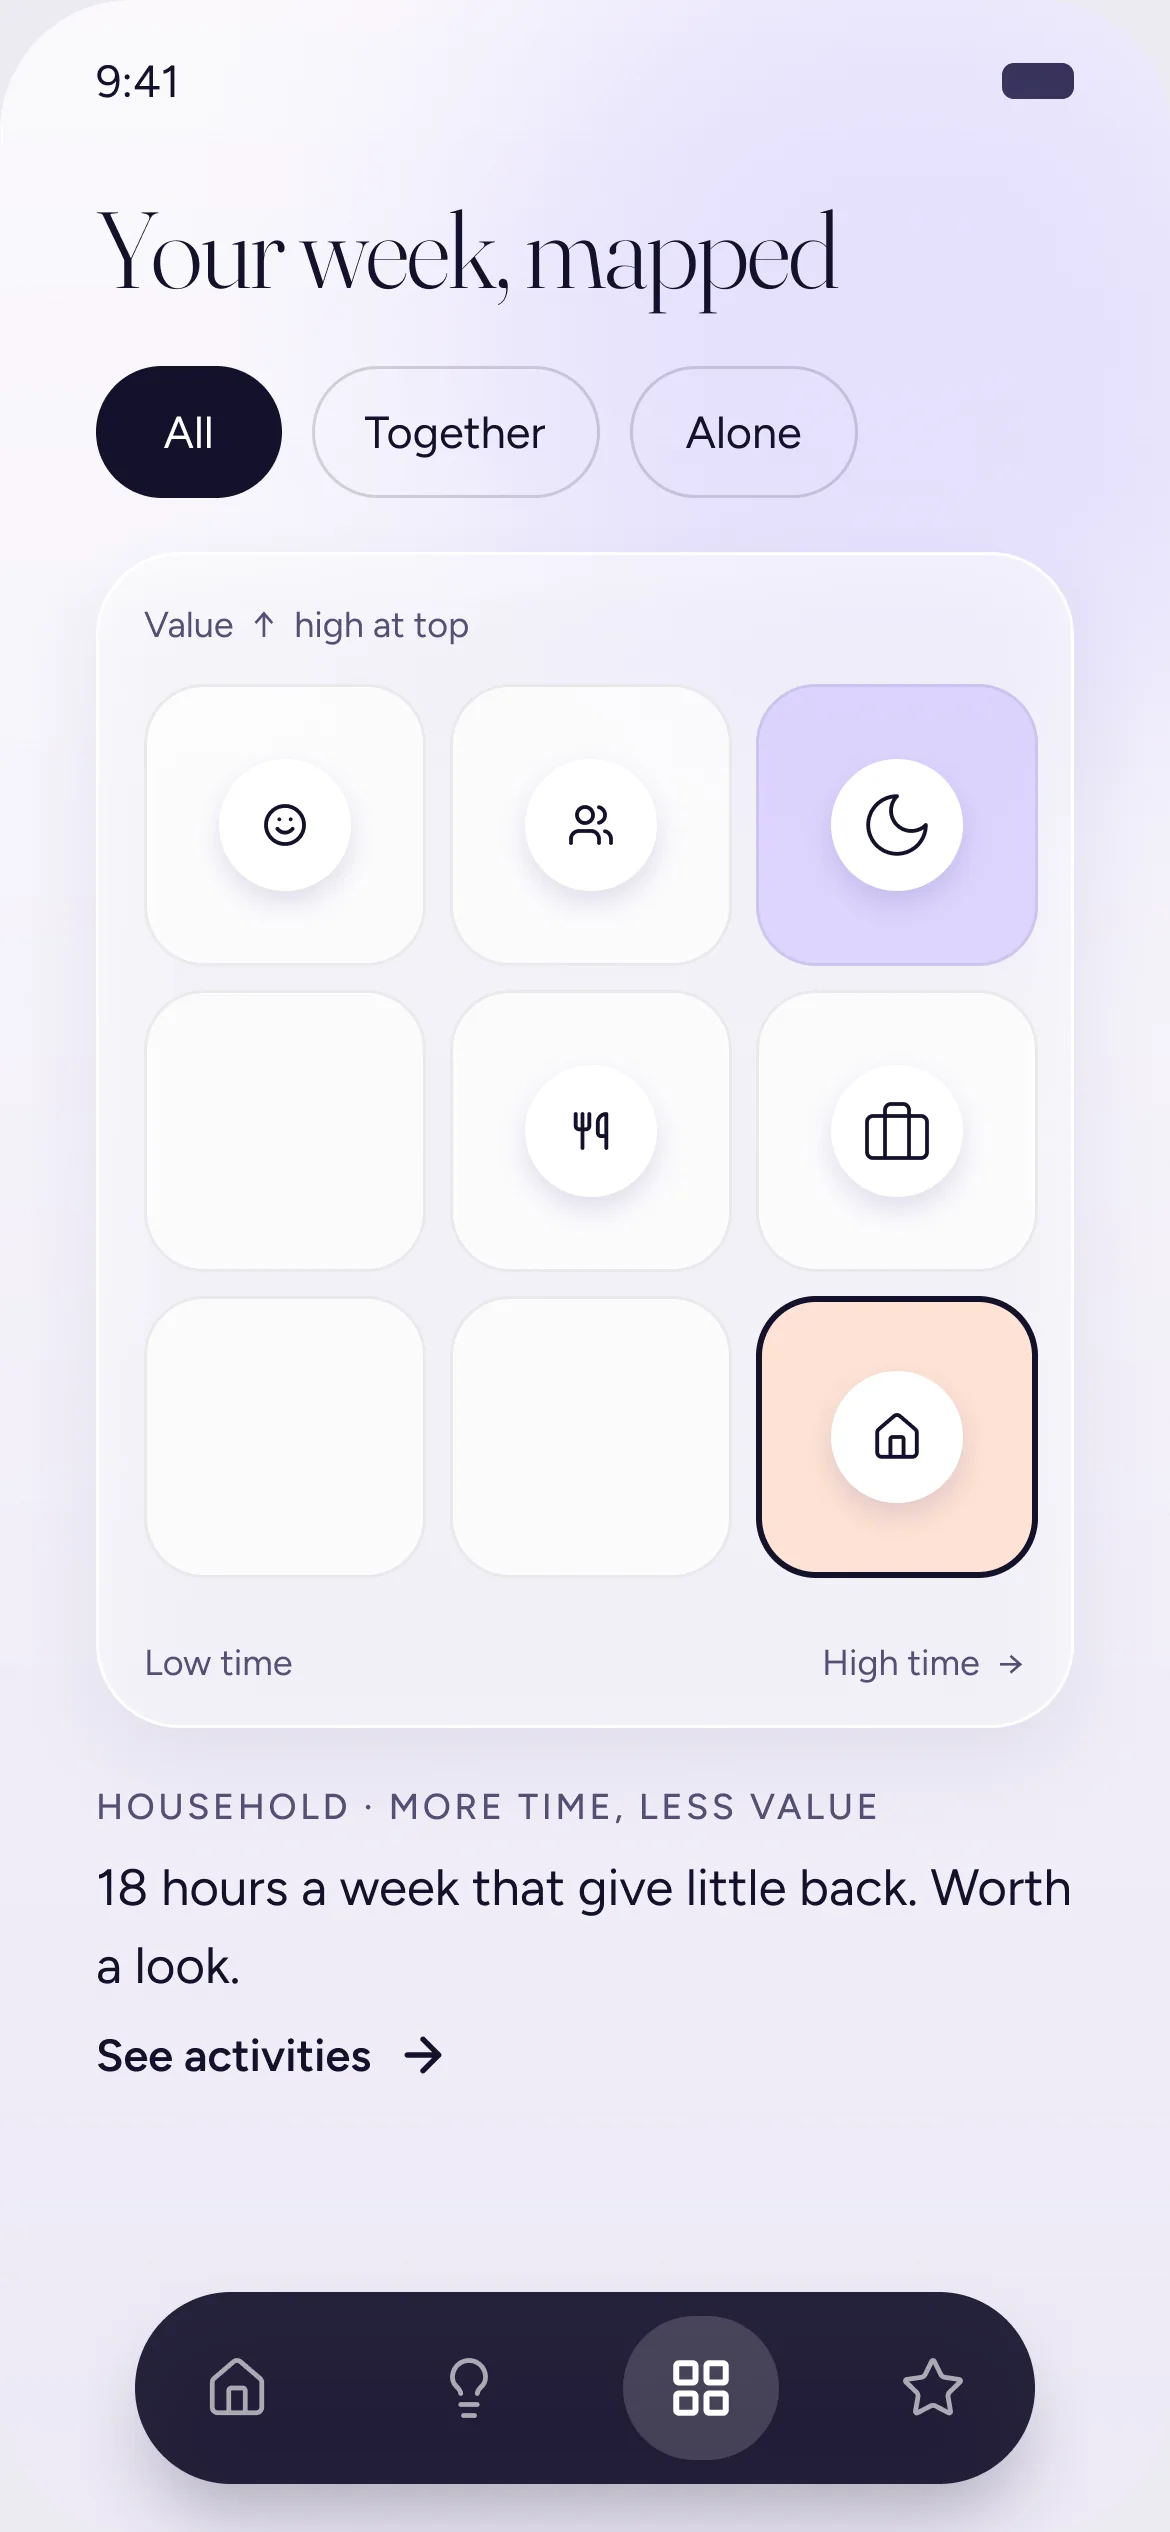
First an overview with real substance: the JAM type. Then the insights. Then the matrix and the actions. Like a starter before the main course, it is enough to feel rewarded and not enough to feel done.
Each layer gives a reason to open the next one. It also fits the goal I wrote for the product: when change feels big and a person does not know where to start, show one clear place to begin.
Working with HBS
I was in the room as the expert in my area, and my input was taken almost in full. There was a lot of change, as in any product. We did not trade things away. We reached agreements.
The science and the content belonged to HBS. Content is part of design, but it is a different job. Key content went to their team to iterate and come back. The experience was mine.
How we worked
A weekly deck: the agenda, what changed, and the questions I needed answered
Design principles to argue with, and prototypes to show the idea
A clear split between the science and the experience
Everything we built was approved by the professors, researchers and doctors on the HBS team.
The Interface
The decisions came first, in 2024. In 2026 I gave the same structure a new visual layer. The order, the pauses and the pace did not change. The screens on this page are that layer, and they follow a few rules.
Hierarchy before decoration
Hairlines and type size organize each screen. Boxes are kept for the few things that need weight.
Three pillars, equal weight
Joy, Achievement and Meaningfulness never rank above each other. Their glass shapes appear only at large size.
The matrix is untouched
The 3x3 grid is a standard way to read this data. I designed everything around it and left it alone.
Built to be used
Touch targets are at least 44 px. Selection is shown with a check and a fill, never with a dot or color alone.
What I Can and Cannot Say
I left before the build, so this case has no usage results. I will not invent any. The research team approved the design, and that is the only validation I claim.
First questions
Where people leave, screen by screen
Time spent in each area
Whether the pause after an area lowers the number of people who leave right after it
How many people come back from a reminder
Long things need rhythm more than they need fewer steps. I design the order, the pauses and the rewards first. Then I make it look good.